Every week in the United States, we can expect 50,000 to 60,000 deaths. This weekly number usually varies by time of year more than any other variable. We expect more deaths each week in January than July, for example.
2020 has been a tough year. COVID 19 issues, separation, economic stress, political tensions and mixed signals from all corners contributed to a challenging year. One look at the graph below shows one reason why 2020 was a challenging year for so many of us.
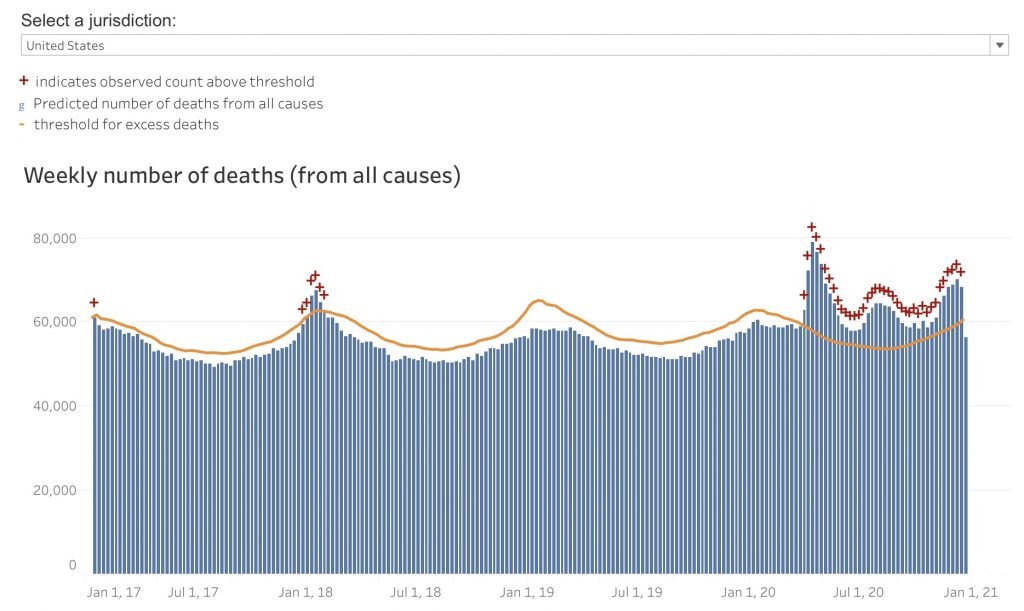
The graph below shows the weekly number of deaths in the United States from ALL causes. Suicide, drug overdose, heart disease, murders, COVID-19, traffic accidents and other external causes are all included in this graph. This graph in not specifically charting excess deaths only by COVID-19.
Deaths in this graph are from ALL causes, including some that may have increased this year with no direct cause related to COVID-19 such as suicide, violence and other internal and external causes. Obviously COVID-19 deaths played a major role in the excess death data seen in this graph.
Weeks marked with a RED + indicate weeks in which the death count for that week was over the expected threshold, thus an “Excess Death”.
This table was obtained from the CDC (Centers for Disease Control and Prevention). “Weekly counts of deaths from all causes were examined including deaths due to COVID-19”.
The CDC site carefully outlines possible errors and estimates associated with this data. Data was gathered from many sources (jurisdictions) and various causes of deaths are reported on a highly variable schedule. Some deaths, for example, are reported immediately and others may take weeks to be reported, due to the nature of the data collection, resulting in estimates and possible errors the site says.
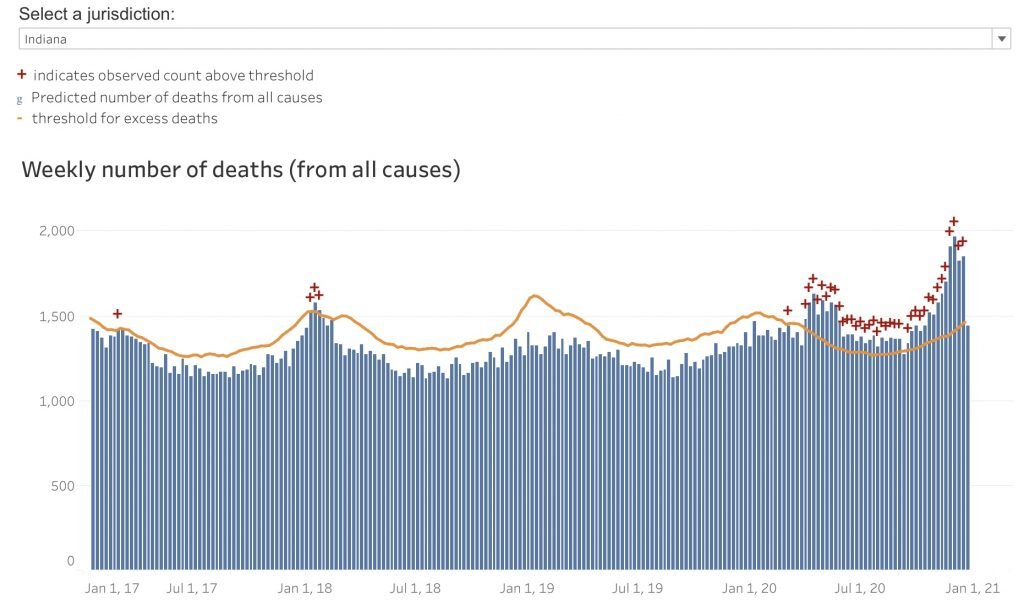
Indiana endured most the same challenges in 2020 and a graph for Indiana follows: