The number of weekly deaths in the United States is approaching normal.
Every week in the United States, according to the CDC (Center for Disease Control and Prevention) we can expect 50,000 to 60,000 deaths. This weekly number varies by time of year more than any other variable. We expect more deaths each week in January than July, for example.
The good news is weekly deaths in the United States and Indiana are rapidly approaching normal expected numbers.
The graph below shows weekly deaths in the United States from ALL causes. Suicide, drug overdose, heart disease, murders, COVID-19, flu, traffic accidents and all other causes are included in this graph. This graph includes COVID-19 deaths and also tracks all other deaths in the U.S.
Obviously COVID-19 deaths play an important but decreasing role in the weekly U.S. death data seen in this graph. This Graph was obtained from the CDC.gov (Center for Disease Control and Prevention) site at 6:59 PM Thursday evening February 25, 2021.
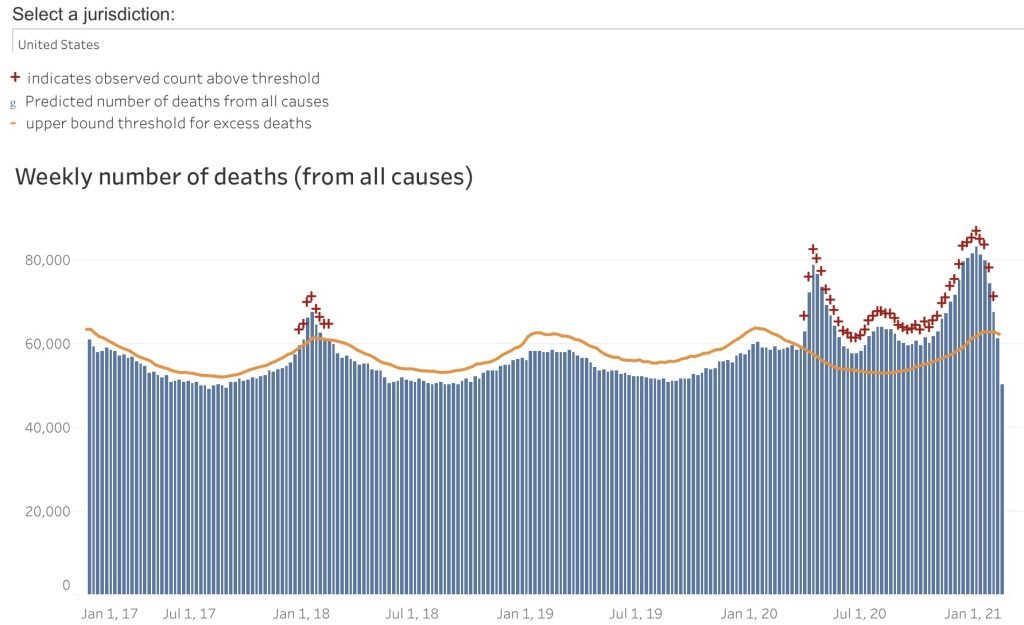
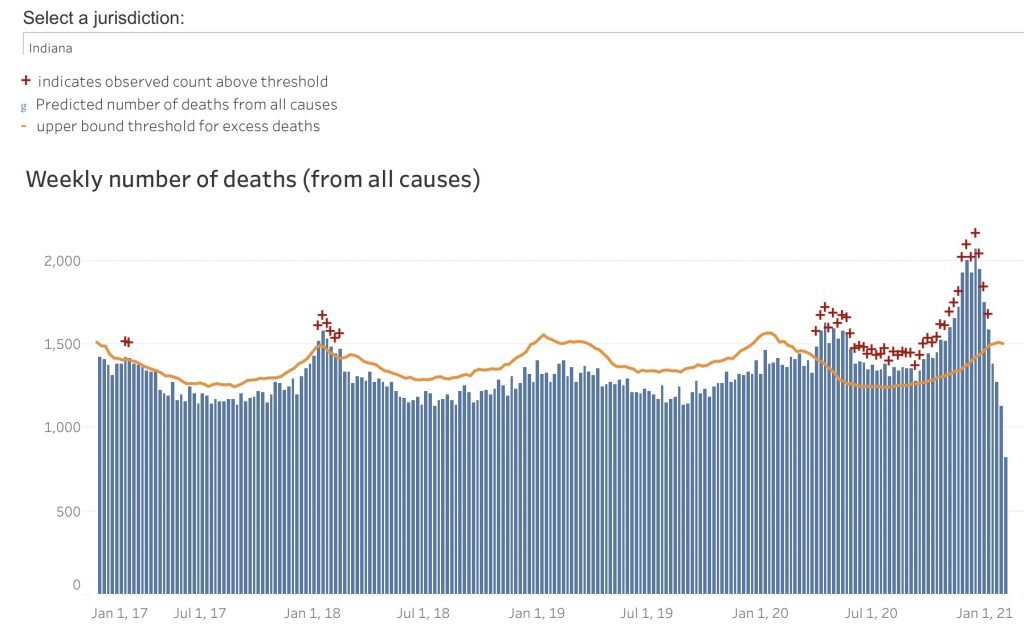
Weeks marked with a RED + indicate weeks in which the death count for that week was over the expected threshold, thus an “Excess Death”.
Excess death rates are plunging in the U.S and Indiana.
This is encouraging news for all Americans and Hoosiers.
The CDC site carefully outlines possible errors and estimates associated with this data. Data used in this graph were gathered from many sources (jurisdictions). Various causes of deaths are reported on a highly variable schedule. Some deaths, for example, are reported immediately and others may take weeks to be reported, due to the nature of the data collection, resulting in estimates and possible errors the site says.
Indiana deaths from all causes are also rapidly approaching normal according to the CDC graph for Indiana: